
Data quality
Quality
When it comes to our eye tracking systems, we hold ourselves to the highest standards of data quality. We also share our performance test procedures so our customers can learn how we test and report our quality metrics.
Extensive test methods and reporting of data quality
As a researcher, it is incredibly important that you can trust the quality of your eye tracking measurements and make informed equipment decisions for your projects.
We use extensive test methodologies to measure and report eye tracker performance under optimal and variant conditions, including typical data collection scenarios.
The test reports detail our accuracy and precision metrics and specify experimental procedures, so you can understand and interpret eye tracking specifications.

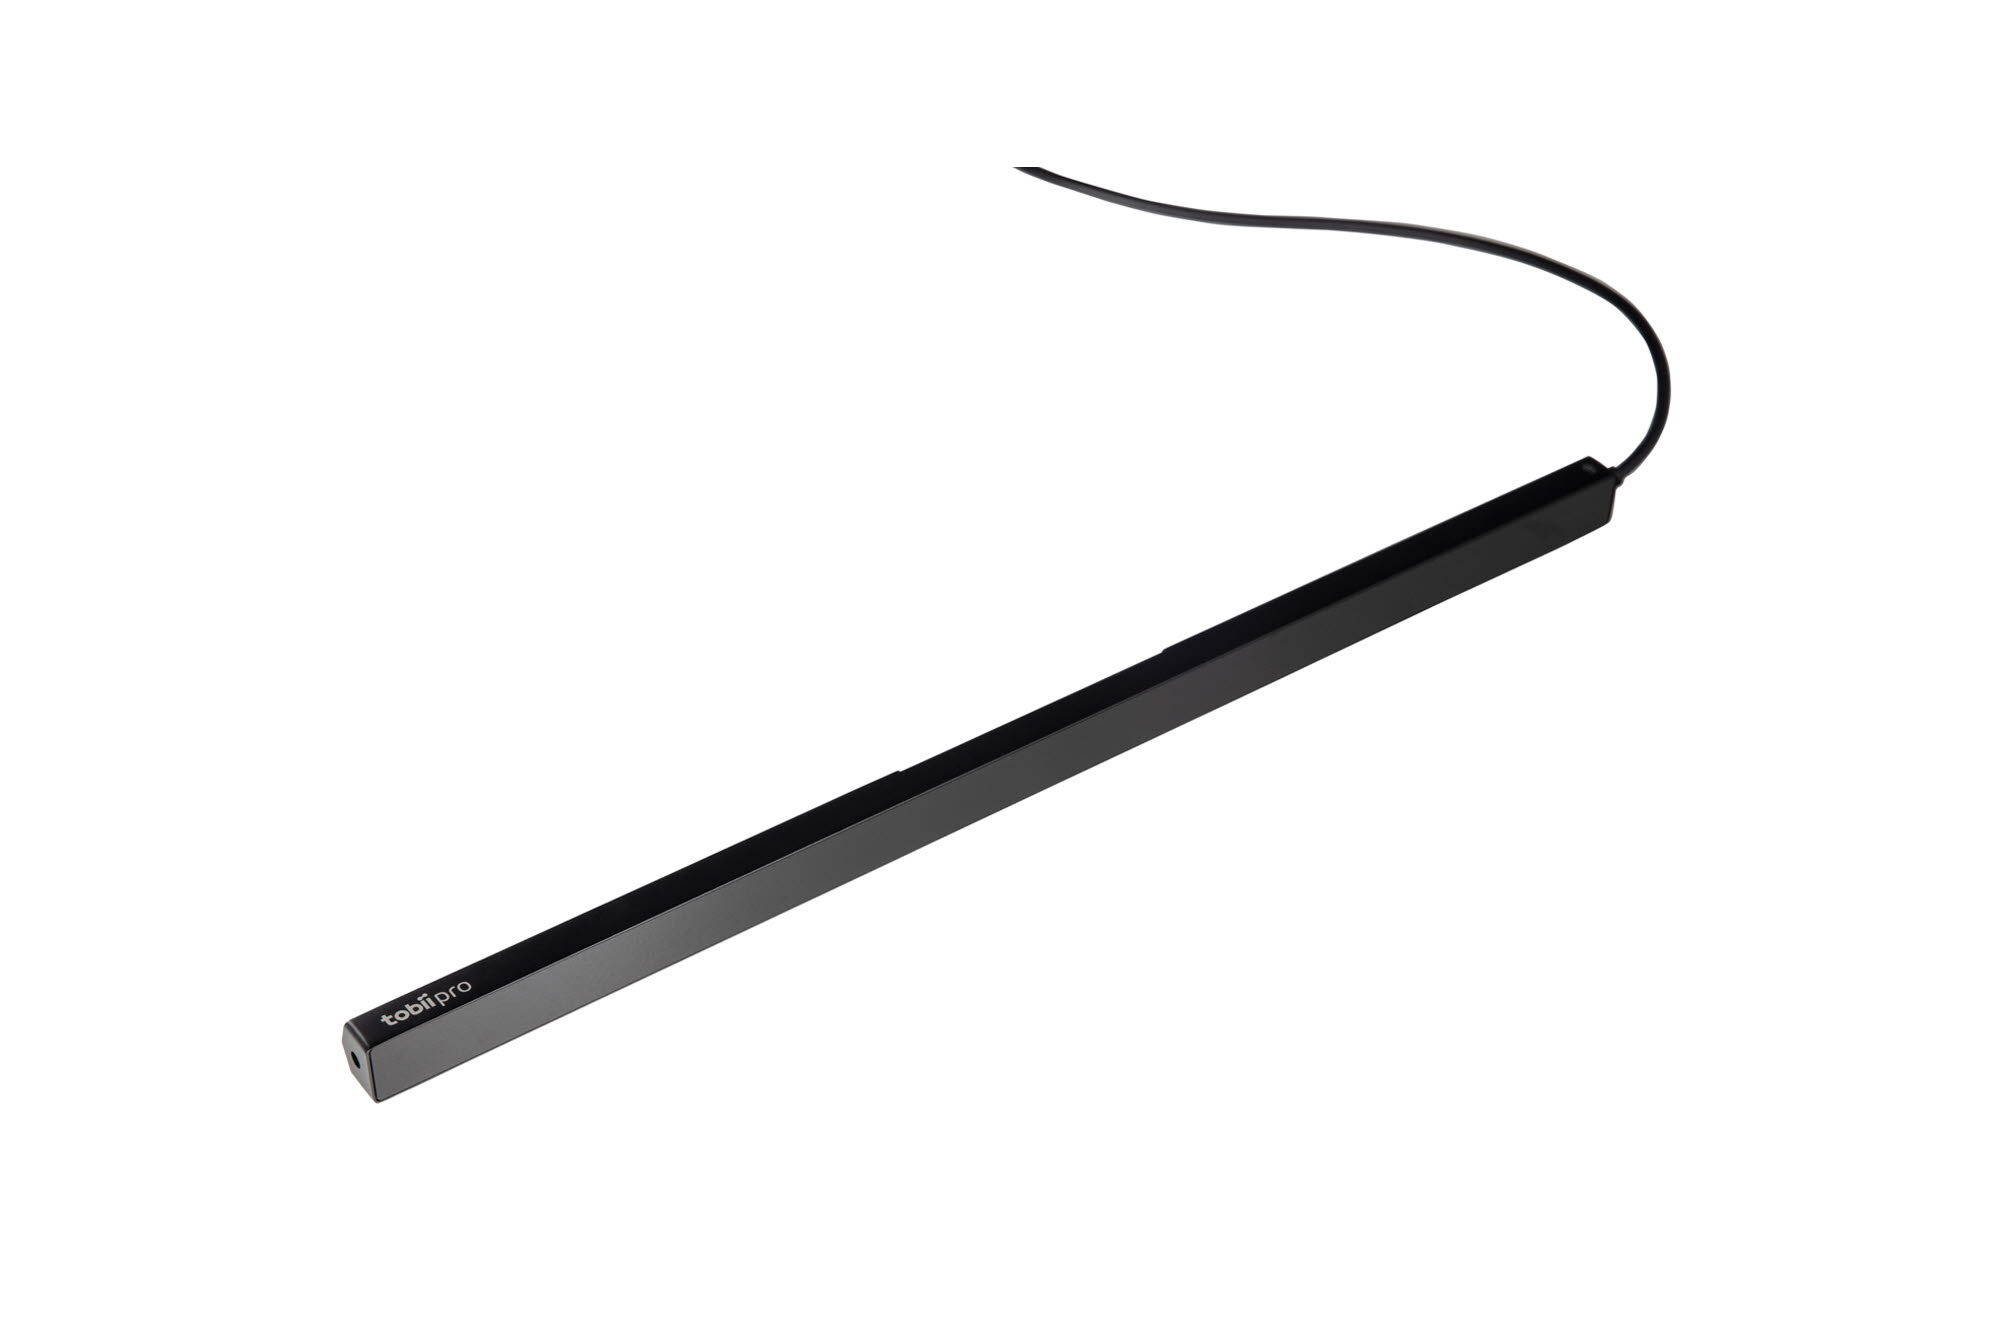
Laboratory metrics test methodology
This methodology provides information on the screen-based eye tracker performance under ideal conditions, as well as the eye tracker’s robustness to different changing conditions.
The test specification includes ideal measurement conditions, head positions in the track box, large gaze angles, and different illumination conditions. Subjects are tested in a controlled lab room setup and use a chinrest to control for distance from the screen and visual angle relative to the eye tracker.
Accuracy and precision are calculated from recordings with a high proportion of valid data. Both metrics are presented based on monocular (dominant eye) and binocular data.
Precision is also measured on artificial eyes to differentiate between system noise and precision of human eyes.

Field metrics test methodology
This new methodology is used to understand screen-based eye tracker performance in less constrained conditions, as well as how participant characteristics influence eye tracking data.
Data is collected over a larger population of subjects and typically in an indoor office or university environment. Subjects are tested without a chin rest – allowing them to move naturally and freely rotate head in front of the screen.
We are proud to share below the first published report, showing results for Tobii Pro Spectrum with over 400 subjects, and Tobii Pro Fusion with over 500 participants.
Watch the webinar
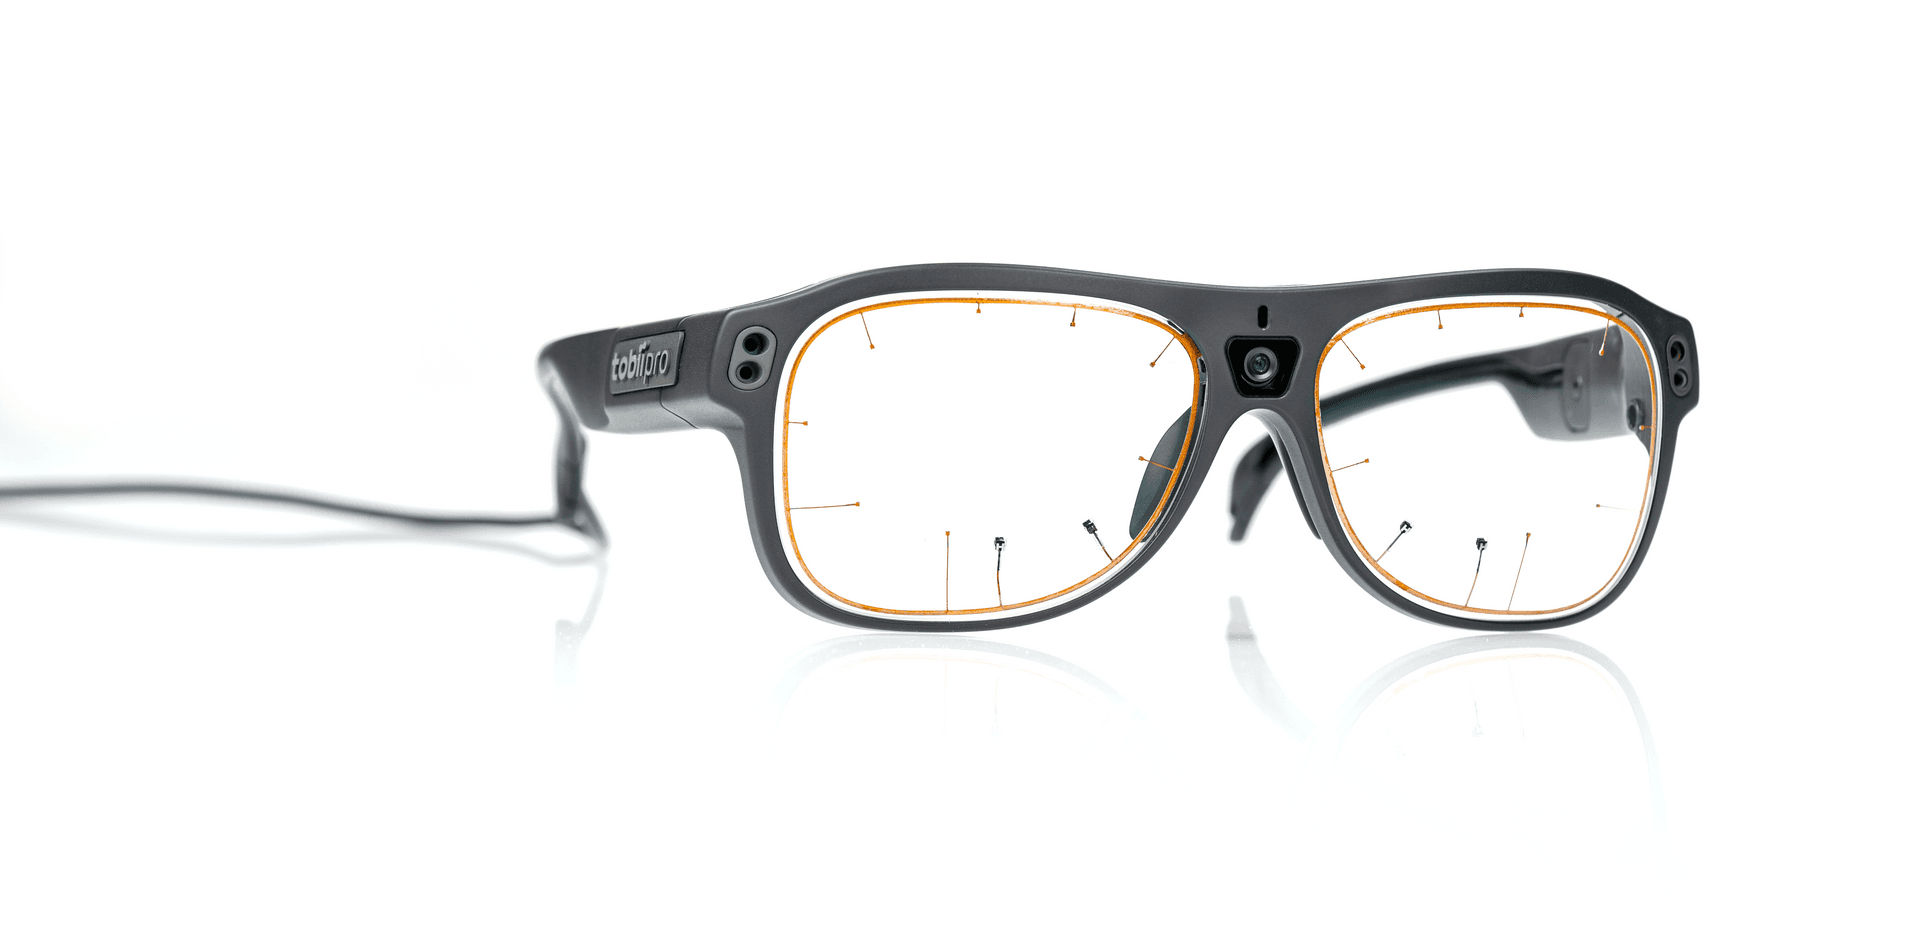
Testing methodology for wearables
Our methodology generates metrics on the performance of our wearable eye tracker, tested under optimal conditions in a controlled environment.
We measured the performance in a controlled lab, varying environmental conditions such as luminance and distance to the target. We also tested the effect of slippage over time during a recording.
Accuracy, precision, and data loss are calculated in different regions of a visual field (central, common, and large gaze angles), with metrics based on binocular data.
Our experts will be happy to provide you with a copy of the Tobii Pro Glasses 3 metrics report.

Testing the quality of the eye openness signal
We have also tested the quality of the eye openness signal in Tobii Pro Spectrum and Tobii Pro Fusion. Eye openness is defined for Tobii eye trackers as the diameter in millimeters of the largest sphere that can be fitted between the upper and lower eyelids.
These tests were performed with 100 participants for each of these eye trackers, in a setup and test environment selected to represent normal usage. Accuracy, precision and data loss were calculated from participants while performing different blink sequences.
You can find below the published reports for Tobii Pro Spectrum and Tobii Pro Fusion.