Eye tracking solutions with a dedicated application, like our software
Tobii Pro Lab, can further process the data to draw valuable conclusions on a wide variety of developmental processes, including:
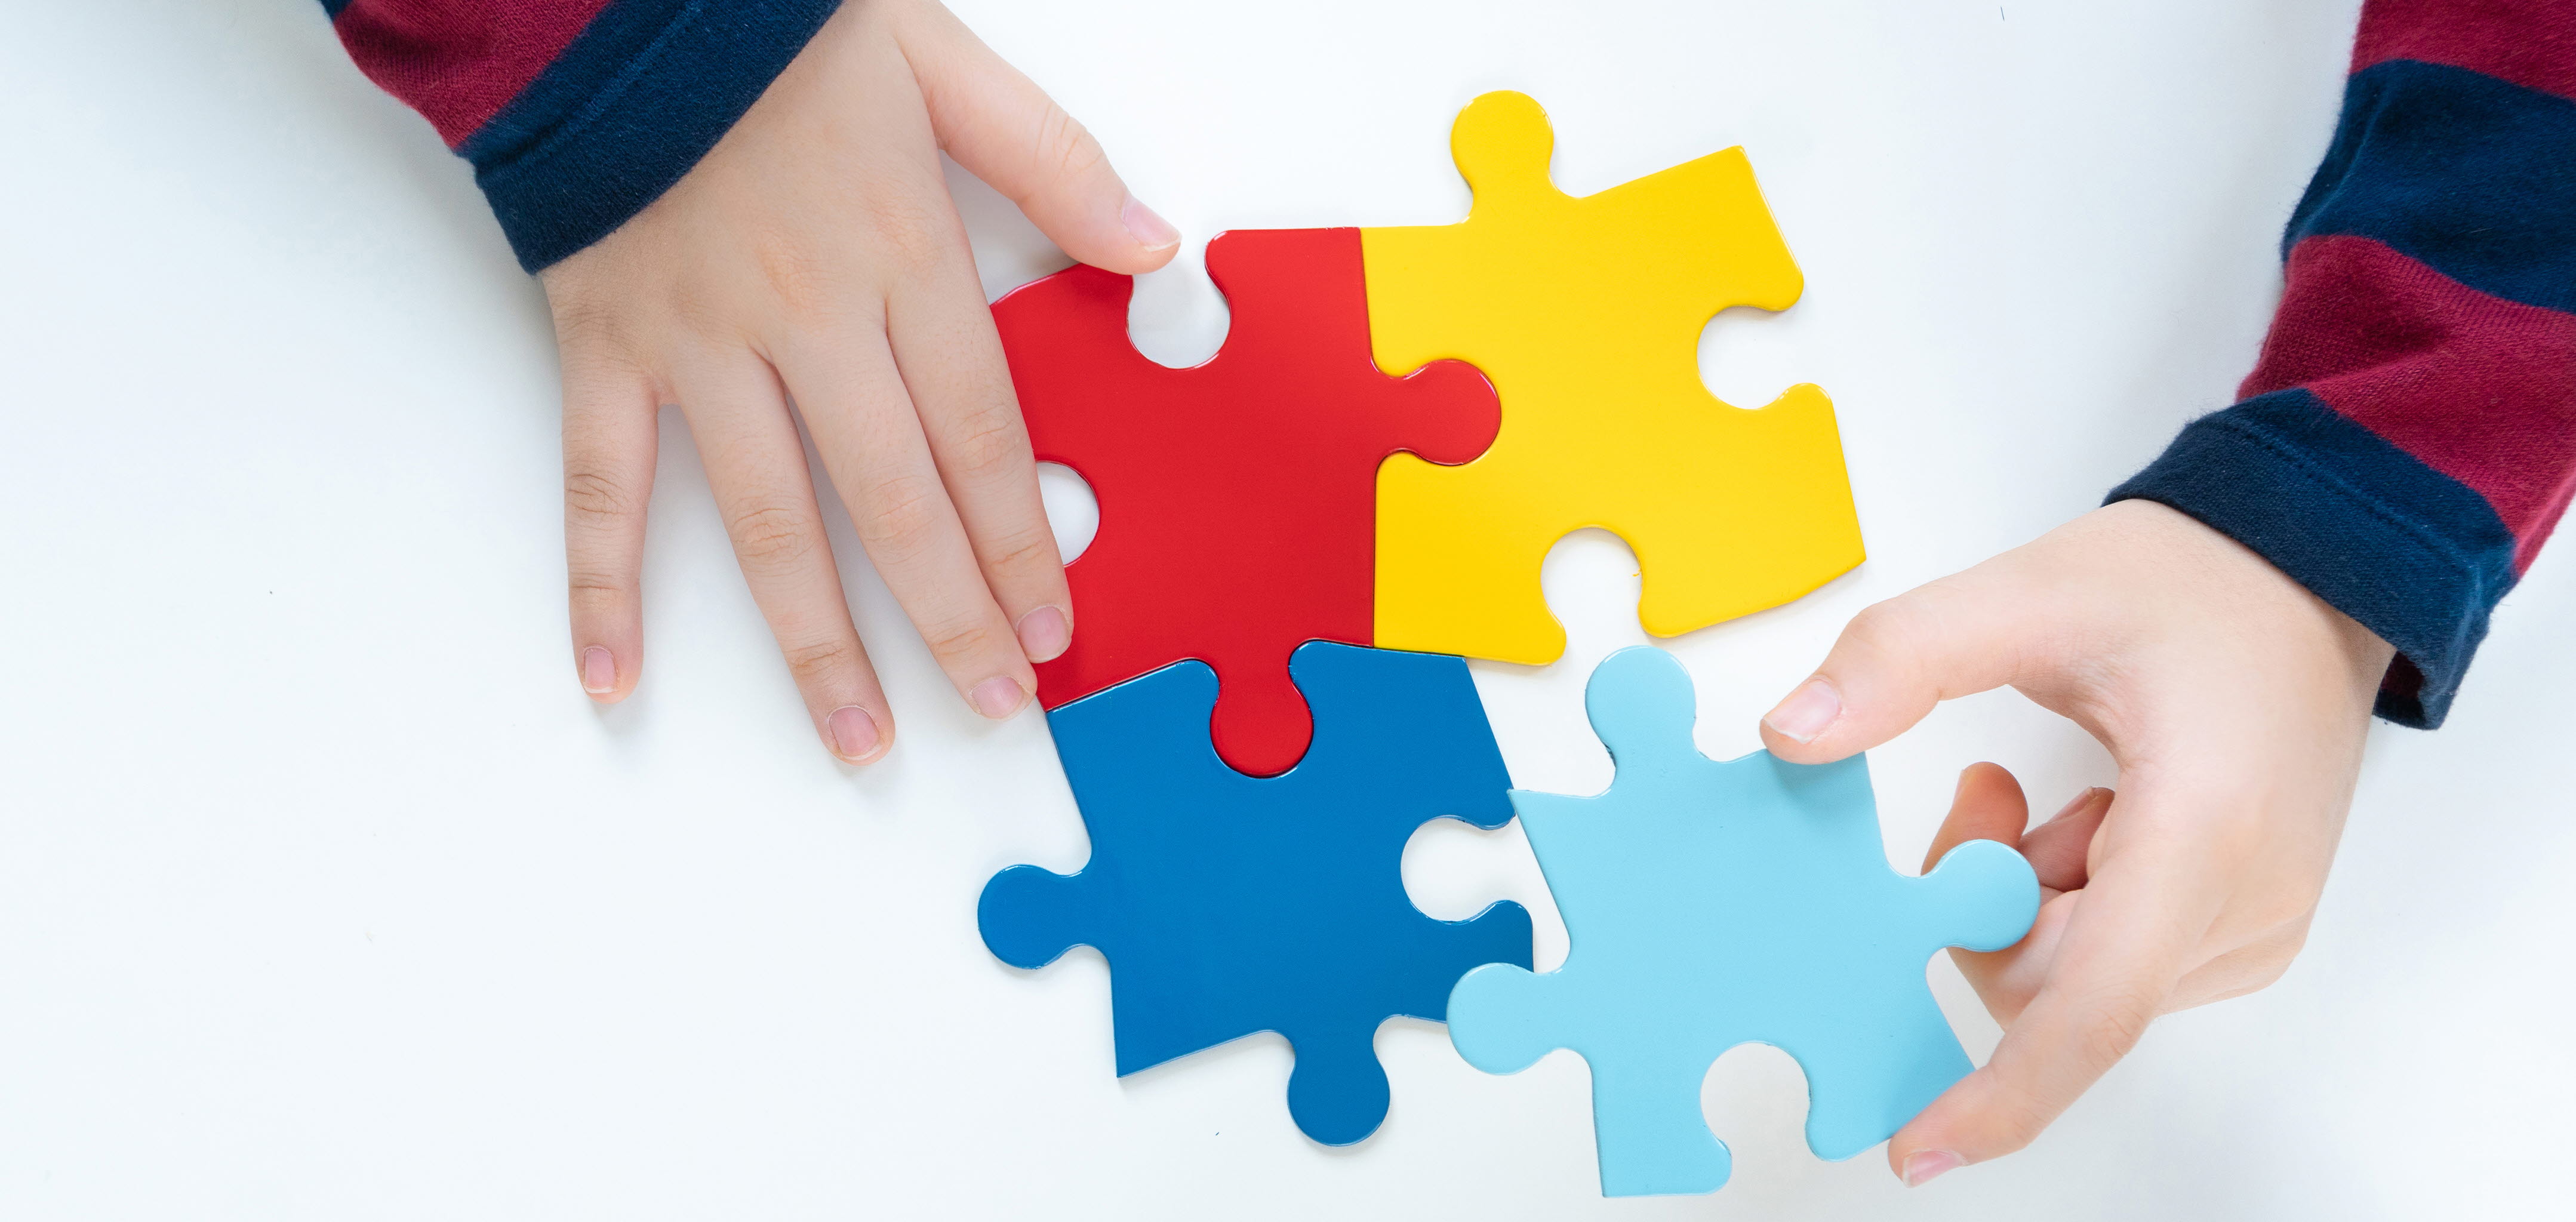
Developmental psychology
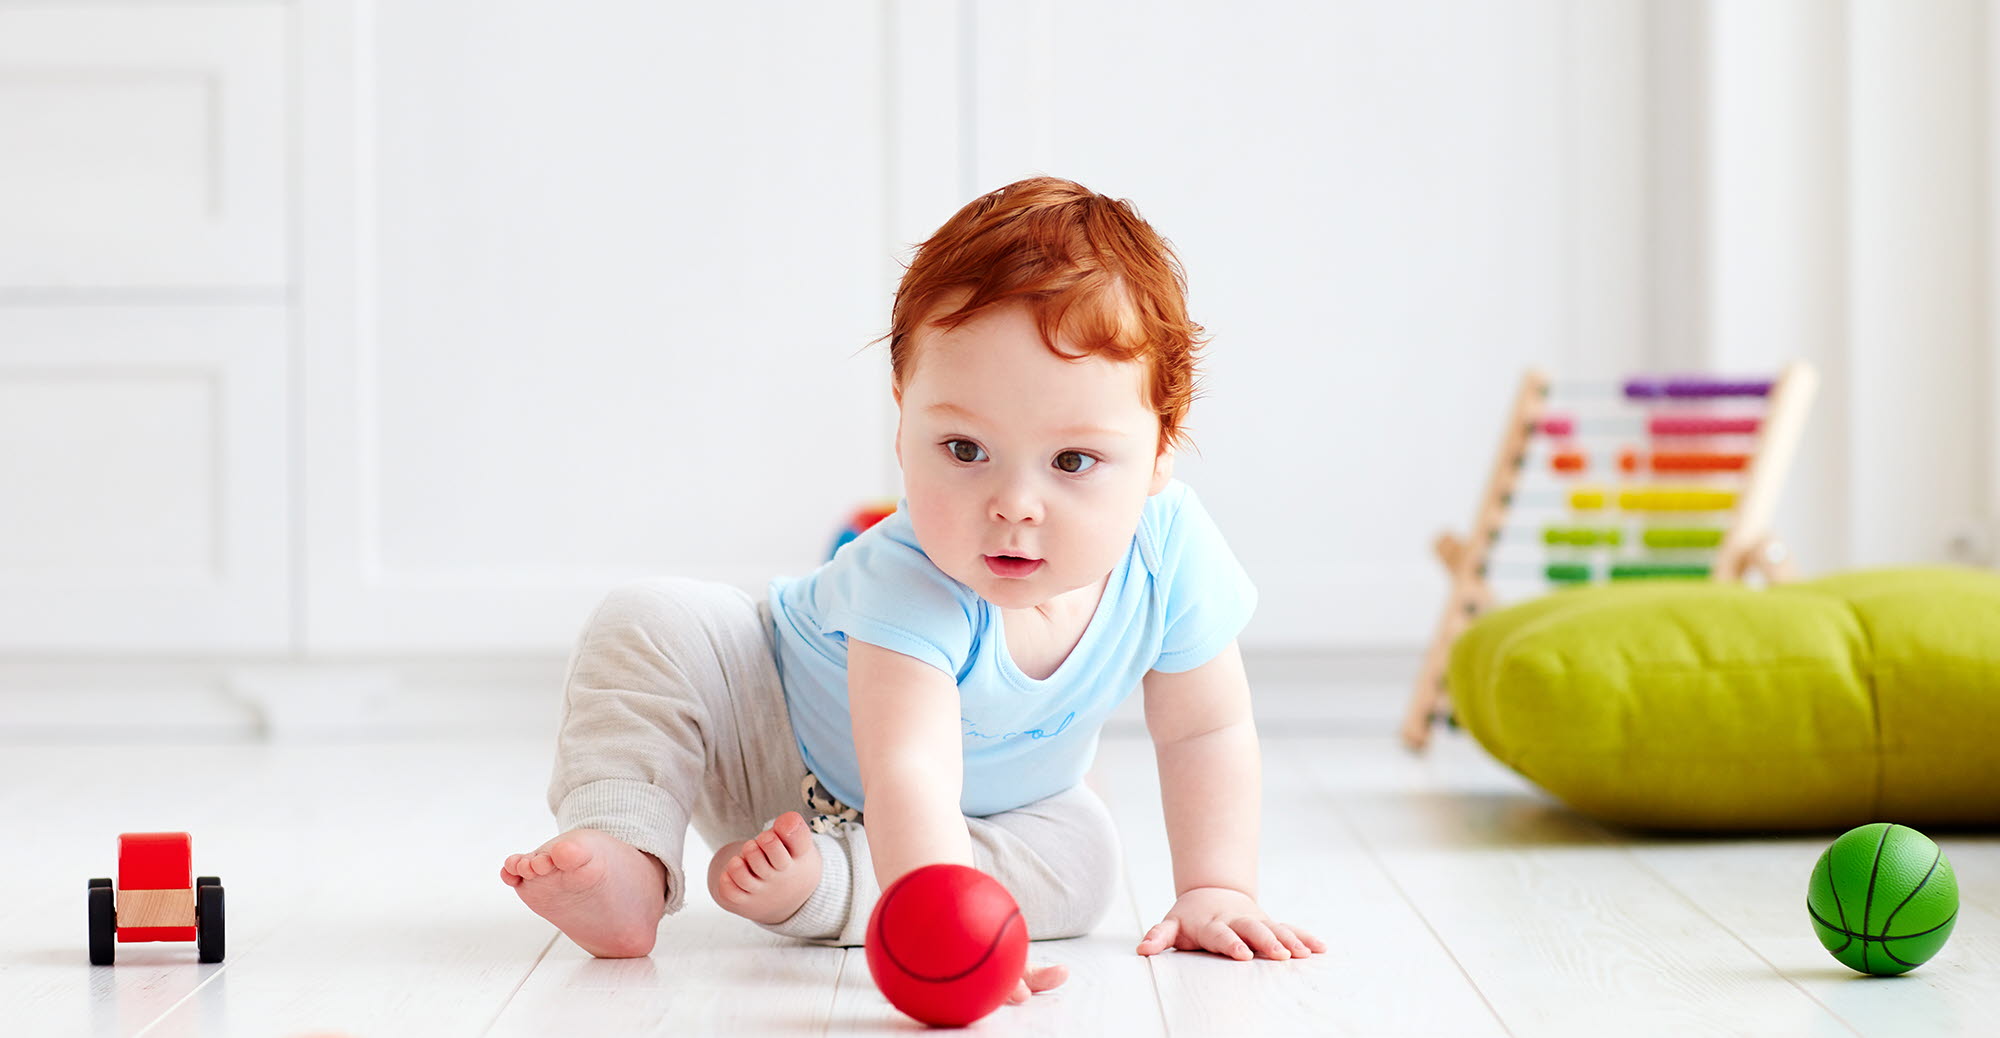
Studying children with the help of eye tracking
Gaze is one of the first abilities infants develop, providing researchers with insight into the development process long before speaking begins.
Why use eye tracking?
Eye tracking is a non-invasive technology that can extract data about an infant's gaze behavior accurately and rapidly without instructions. It provides developmental researchers with a means to enter the child's mind and determine when capabilities emerge and how they develop over time.
What you can measure with eye tracking
- Visual perception
- Development of control of action
- Social cognition and interaction
- Oculomotor function development
- Language acquisition
- Clinical developmental research in areas such as early diagnosis of autism spectrum disorder and ADHD
What you can study with eye tracking data
There are many ways to leverage eye tracking data in developmental research.
Shows how a child assesses facial expressions Shows how a child assesses facial expressions
Reveals their ability to apply understanding and recall Reveals their ability to apply understanding and recall
Discovers relevant processes in the first stages of life Discovers relevant processes in the first stages of life
Anticipatory eye movements reveal knowledge about structural or perceptual completion Anticipatory eye movements reveal knowledge about structural or perceptual completion
Pupil dilation measures a child's arousal and violation of expectations Pupil dilation measures a child's arousal and violation of expectations
Helps to understand oculomotor development, such as object-tracking ability Helps to understand oculomotor development, such as object-tracking ability

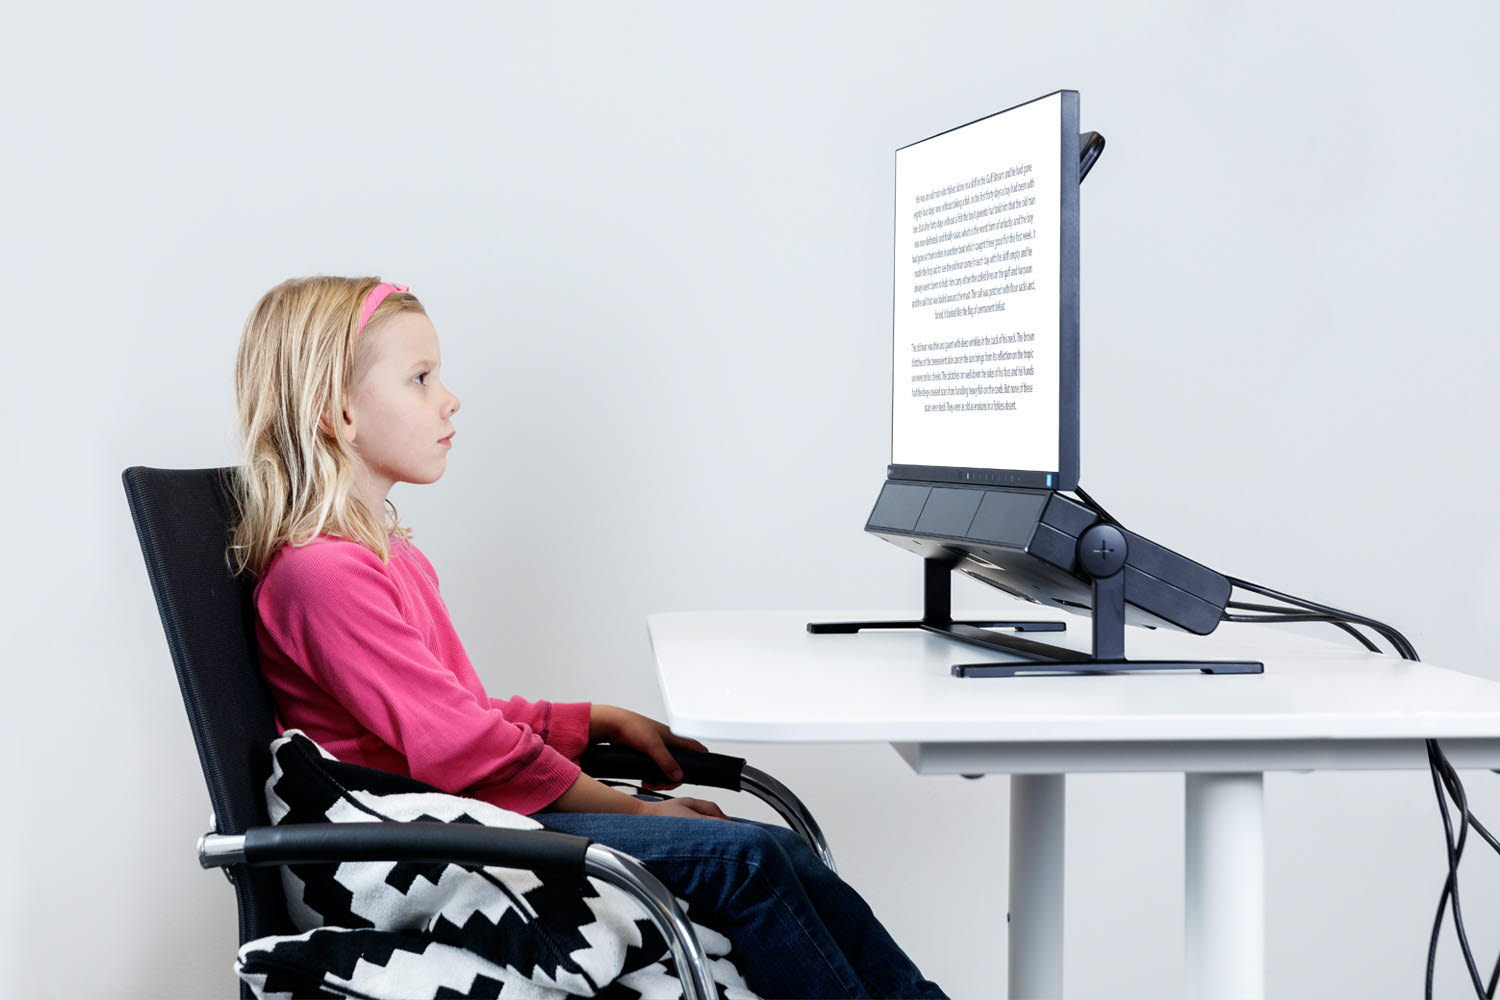
Research setups for infant and child studies
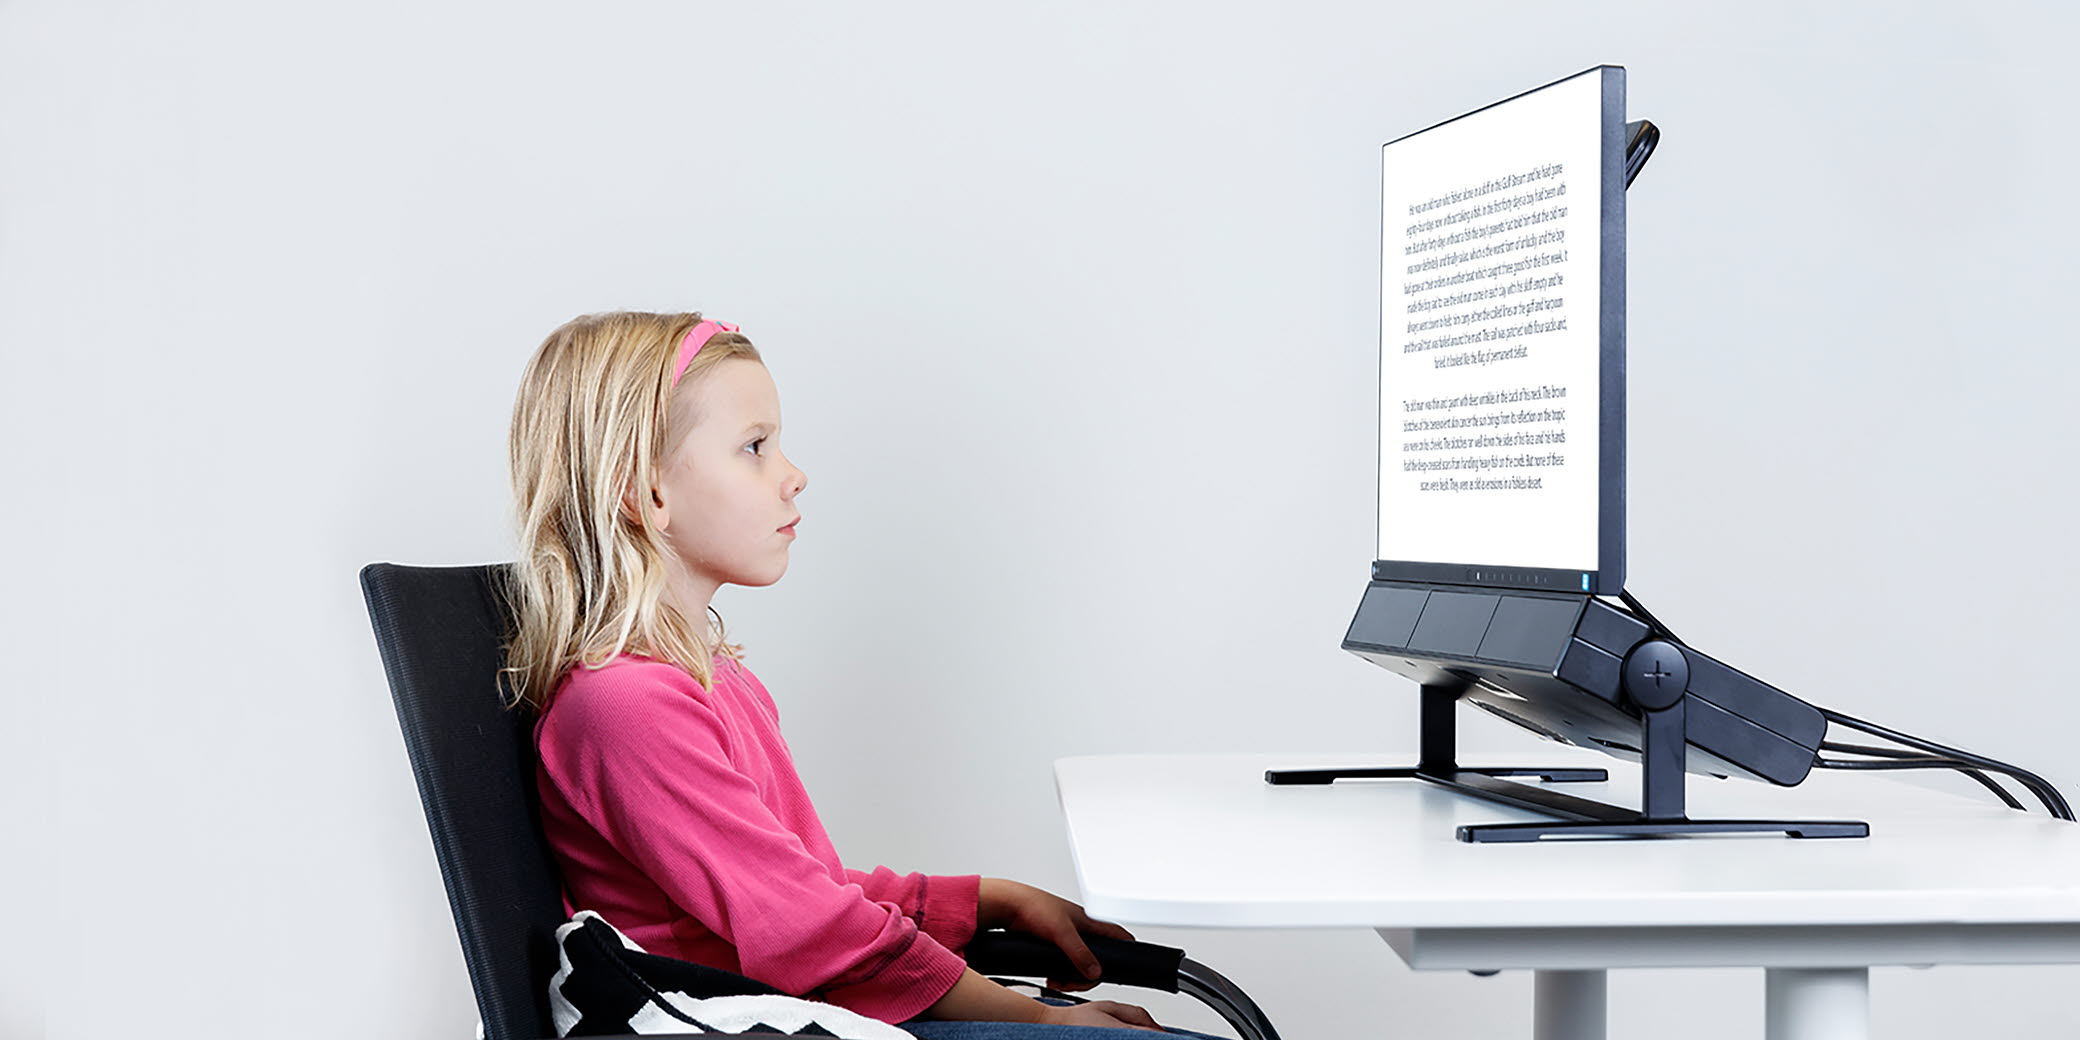
Screen-based for the lab
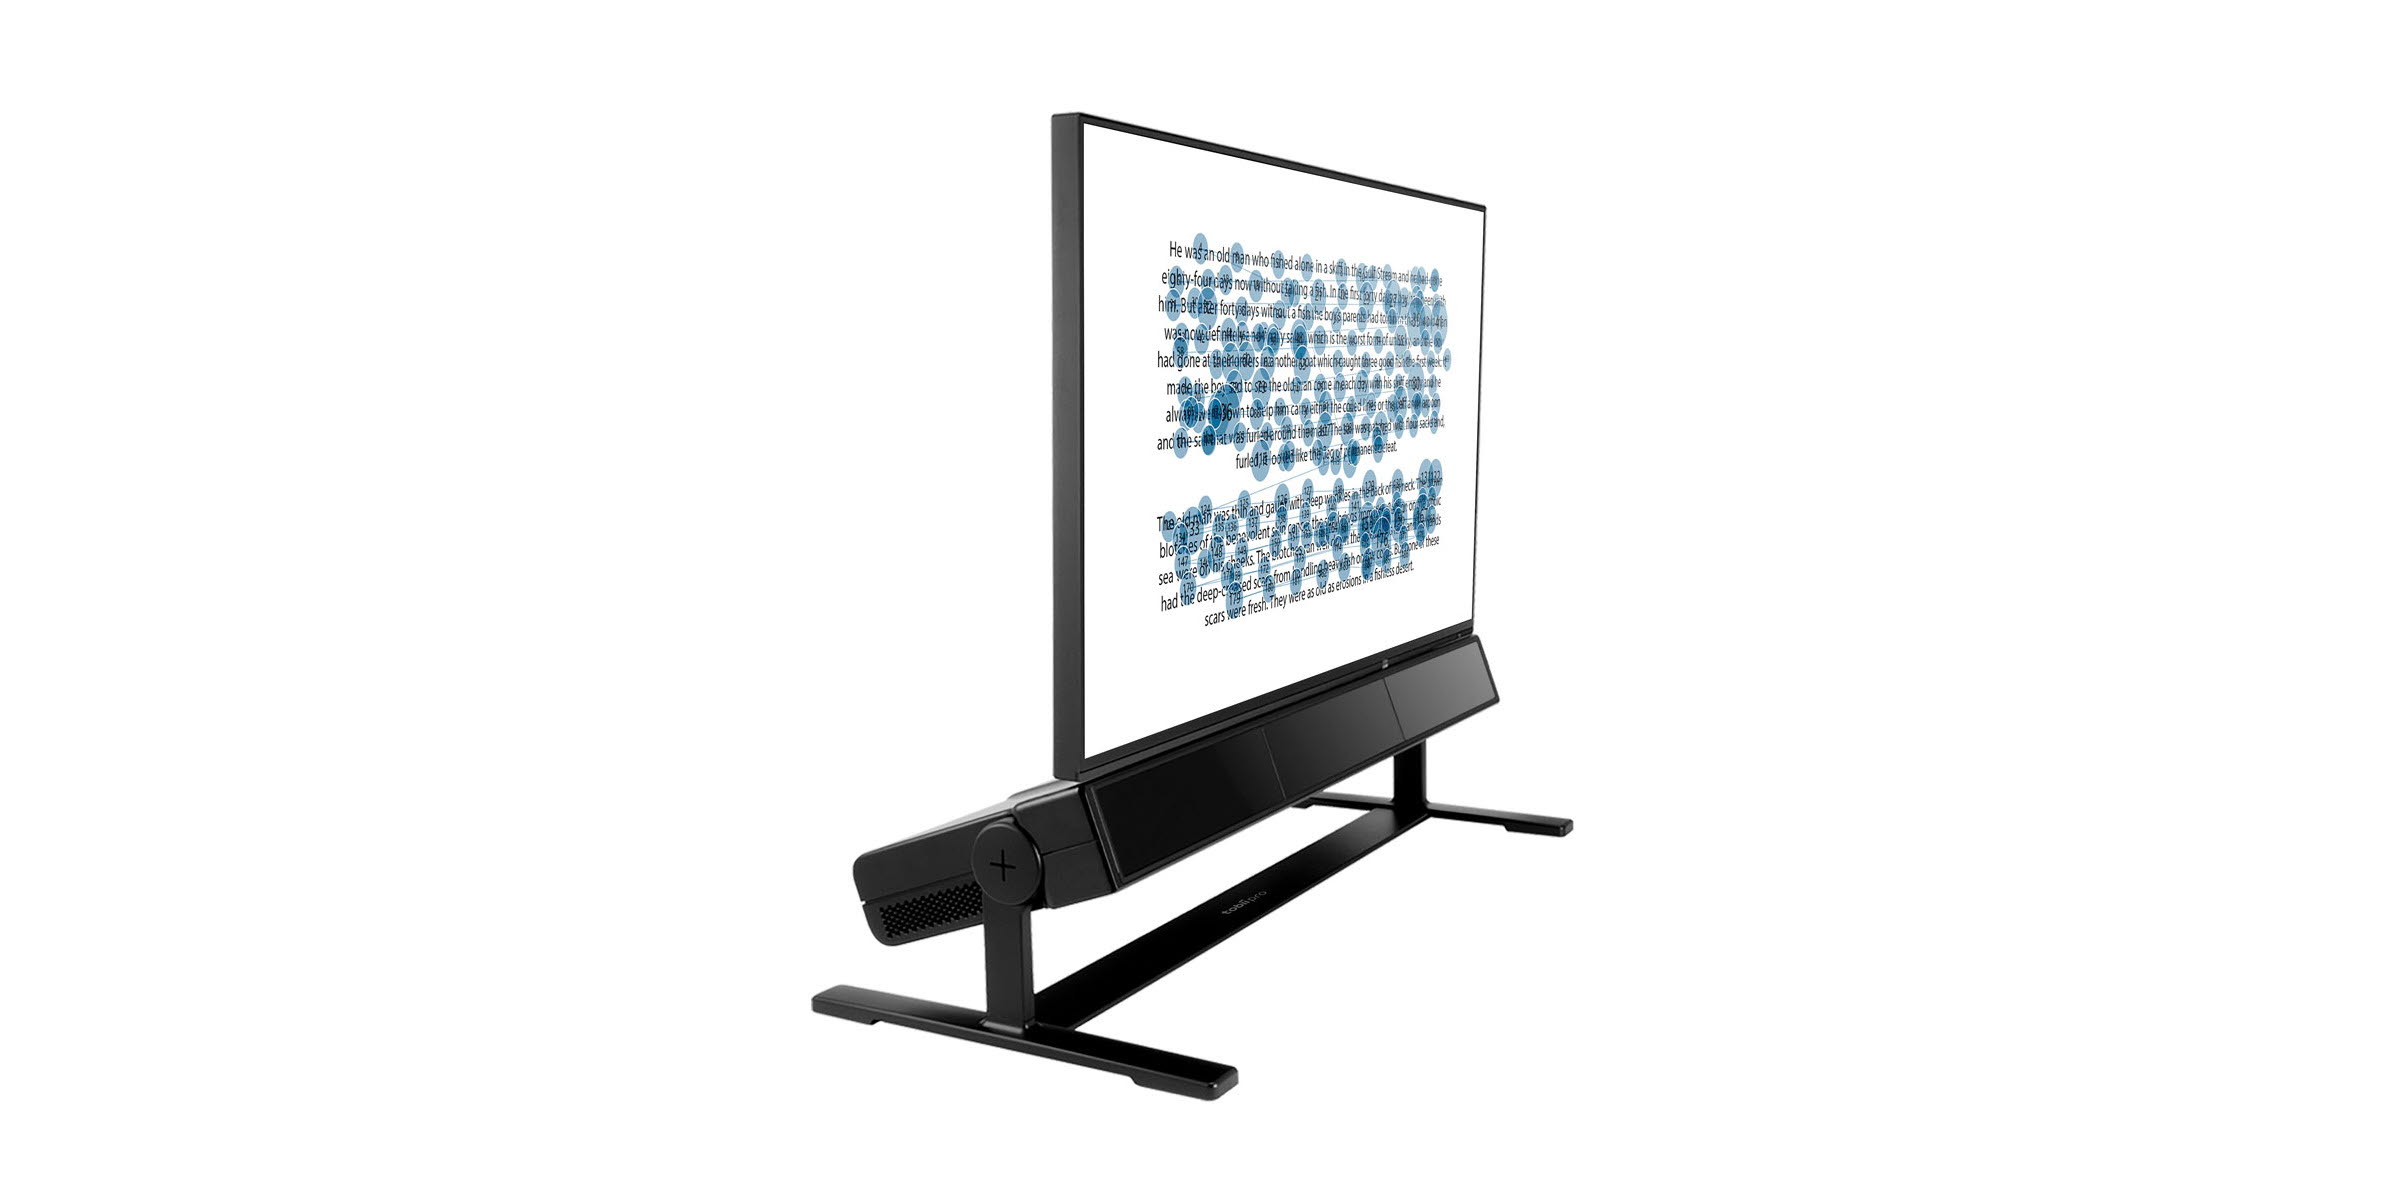
For lab environments, our screen-based eye trackers,
Tobii Pro Spectrum and Tobii Pro Fusion, produce visual stimuli on a screen and work together with Tobii Pro Lab to deliver insights on study participant reactions.
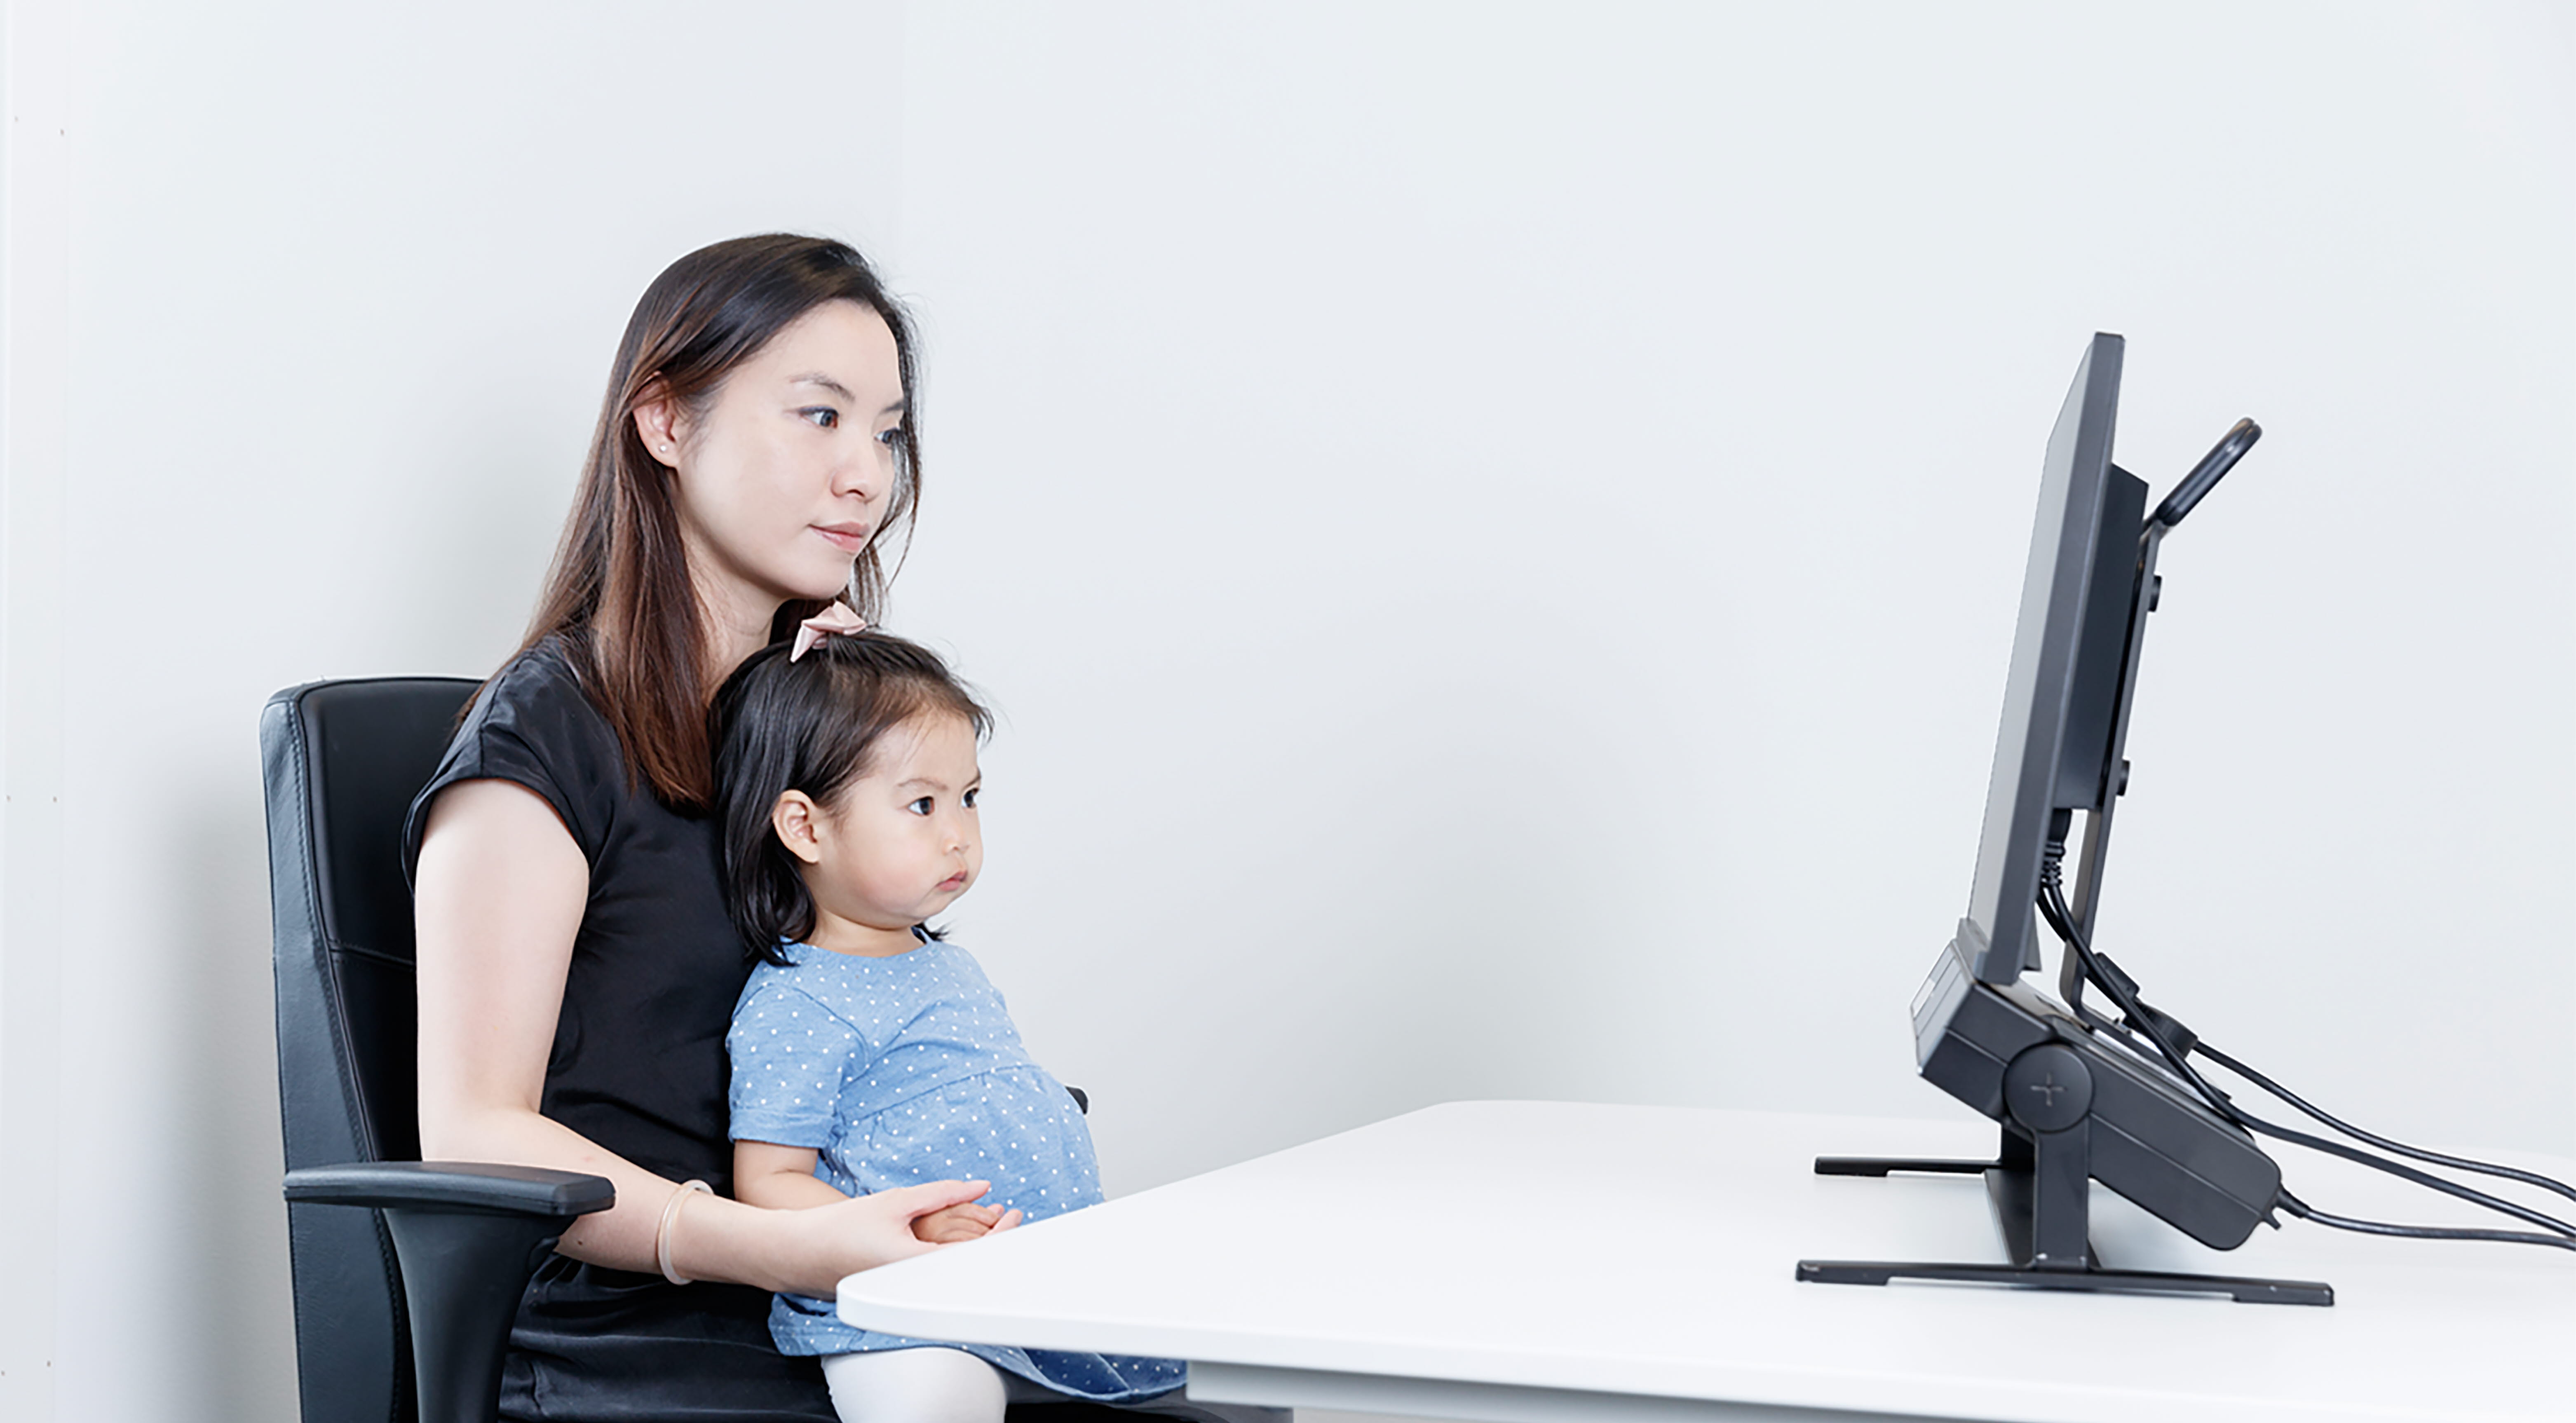
Screen-based for the field
You can connect the plug-and-play Tobii Pro Fusion eye tracker to any screen at a school, hospital, or library to collect data in the field in a nonintrusive way. Works together with Tobii Pro Lab to deliver insights on behavior.
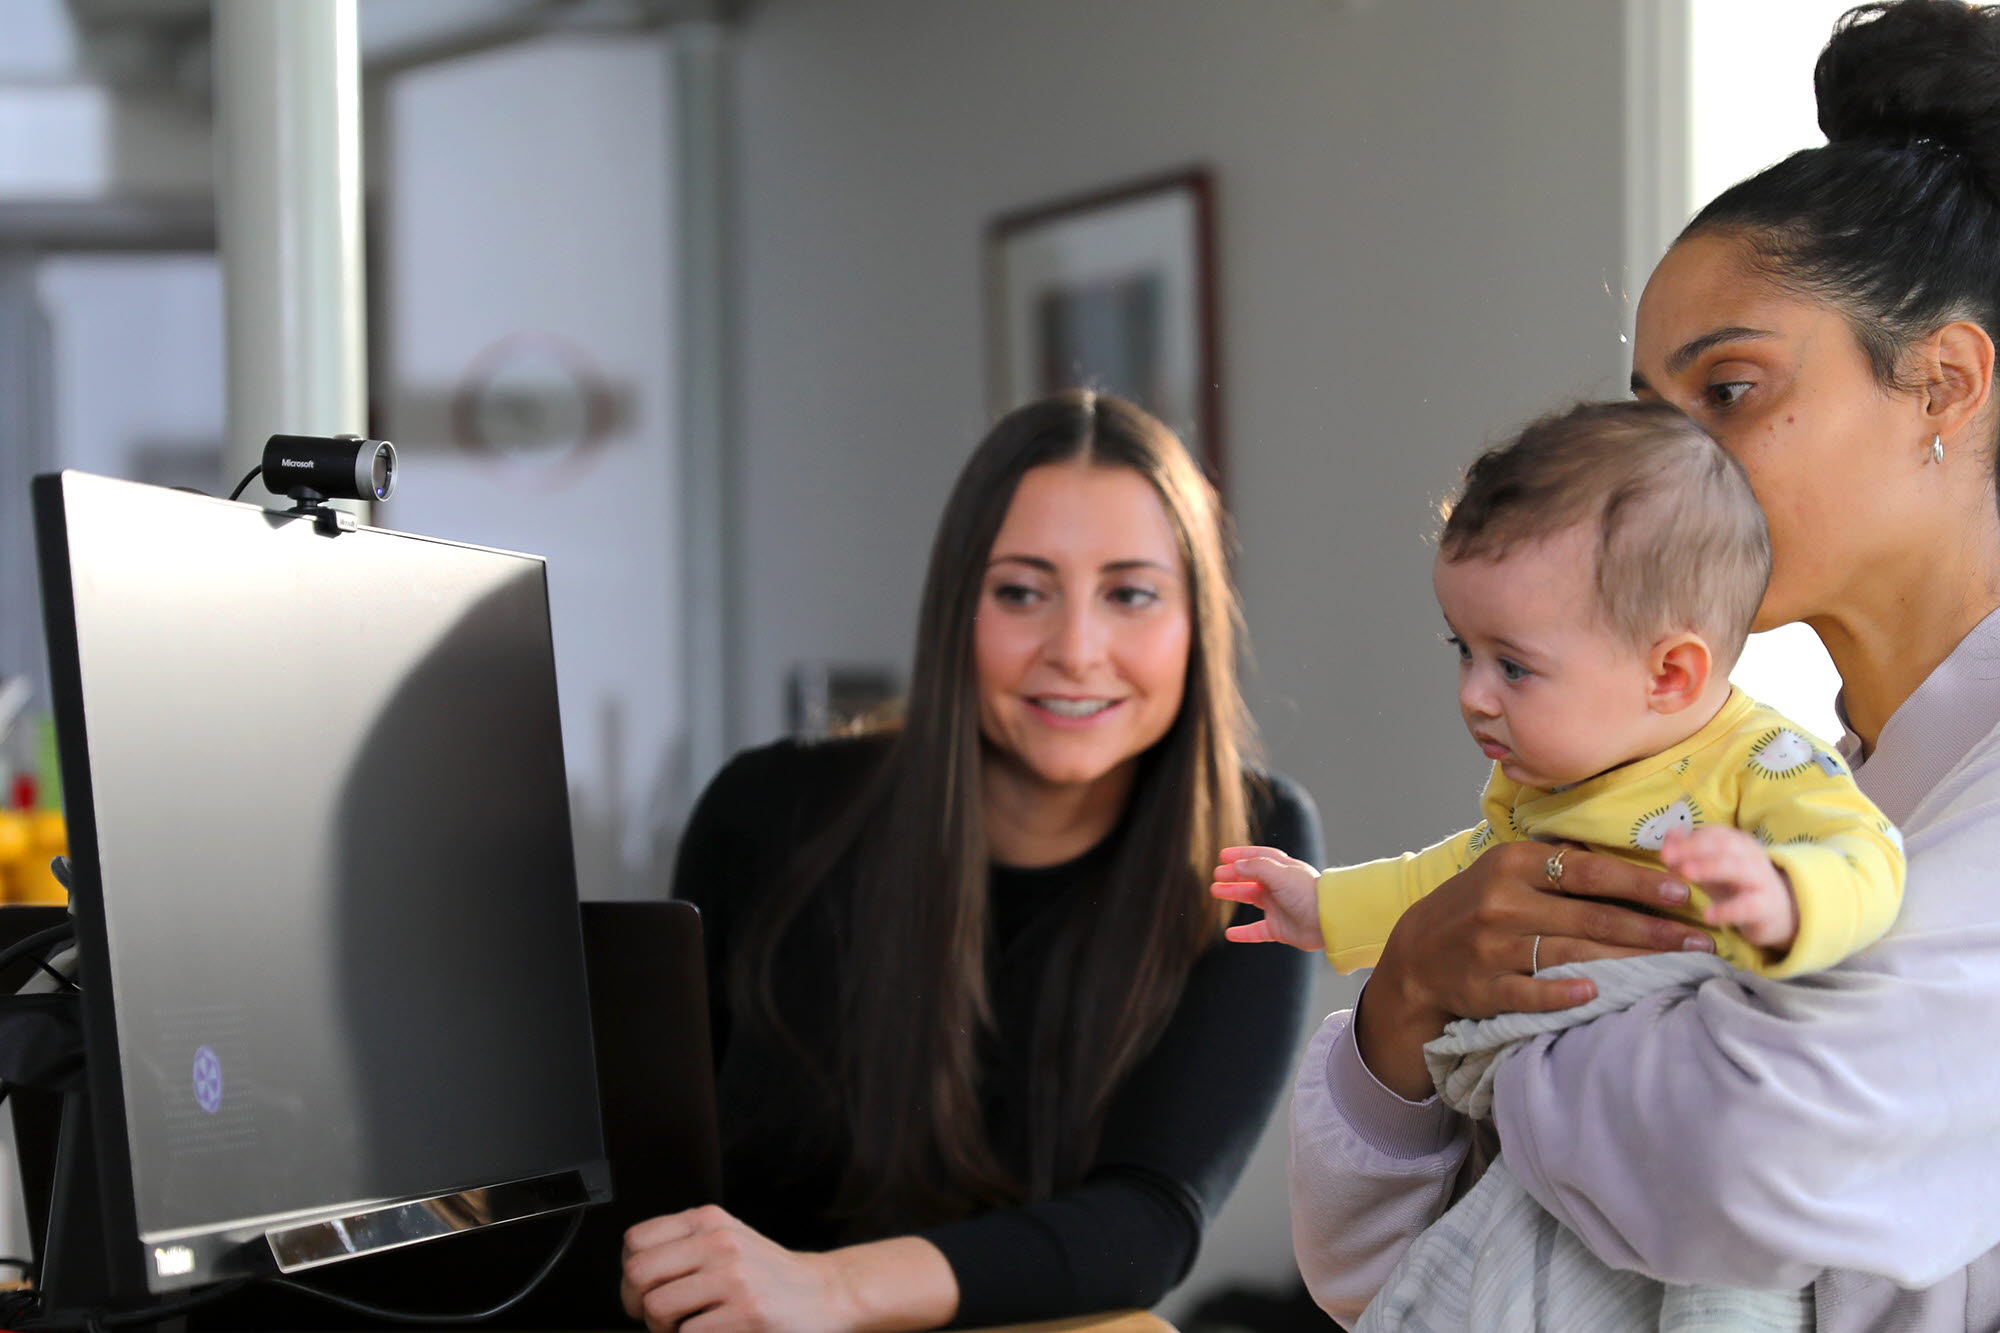
Standalone for the lab
With Tobii Pro Spectrum in standalone mode, data capture can take place while children observe or interact with people and physical objects. Works together with Tobii Pro Lab to deliver insights on behavior.
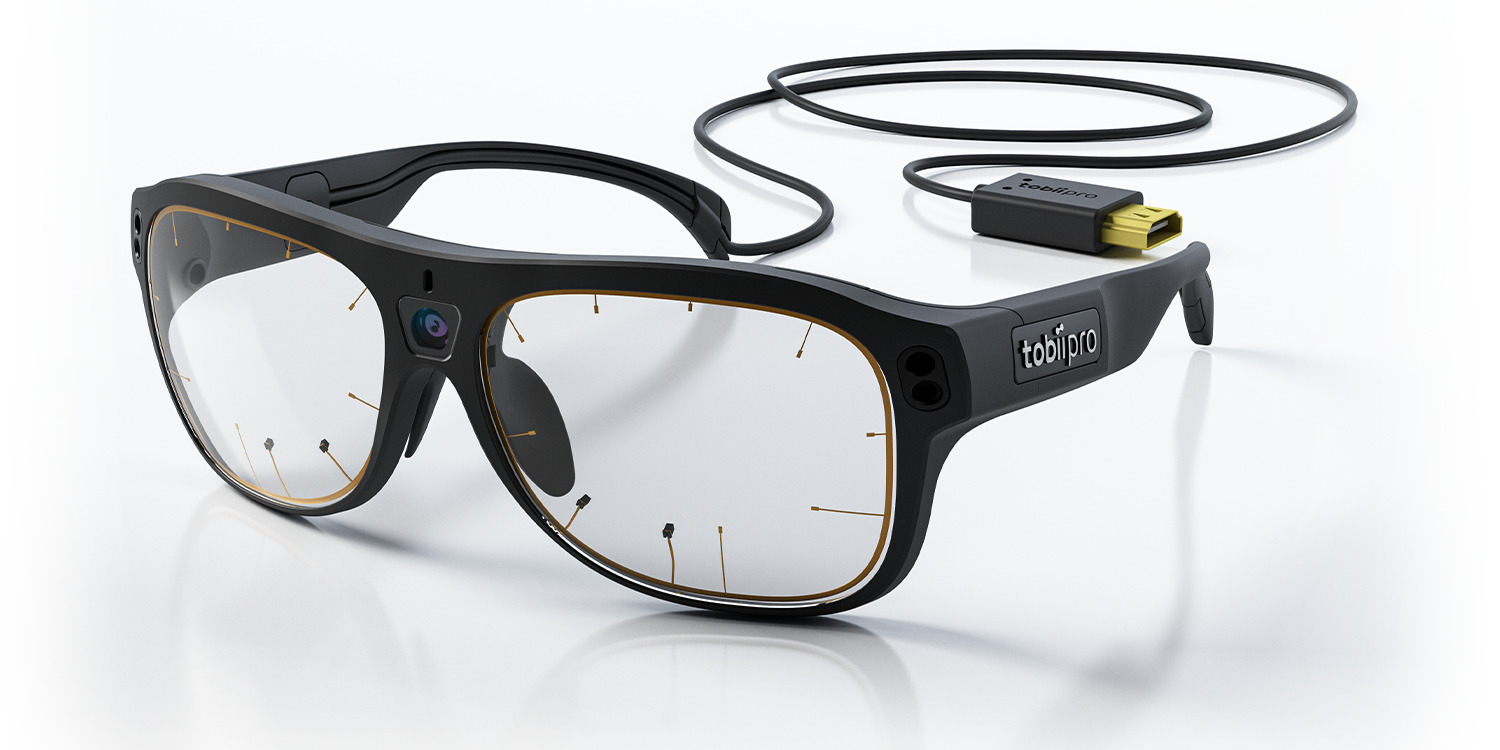
Wearable for the real world
Designed for on-the-go data capture, our Tobii Pro Glasses 3 wearable eye tracker (suitable for 5+ years) allows children to interact and move around freely, enabling you to design studies that closely reflect real-world scenarios — for the lab and the field.
Related content
Developmental psychology — Use cases
Eye tracking enhances the developmental study of infants, as well as children with short attention spans and limited instruction comprehension.

Three scientific studies shed new light on early learning processes
Researchers use attention computing to reveal the impact on how kids learn of: attention bias to faces, individual preferences, and social interaction.

Eye tracking explains development of infants’ abilities
Eye tracking is used in developmental psychology to explain infants' growth and transformation in cognitive, social and emotional abilities.
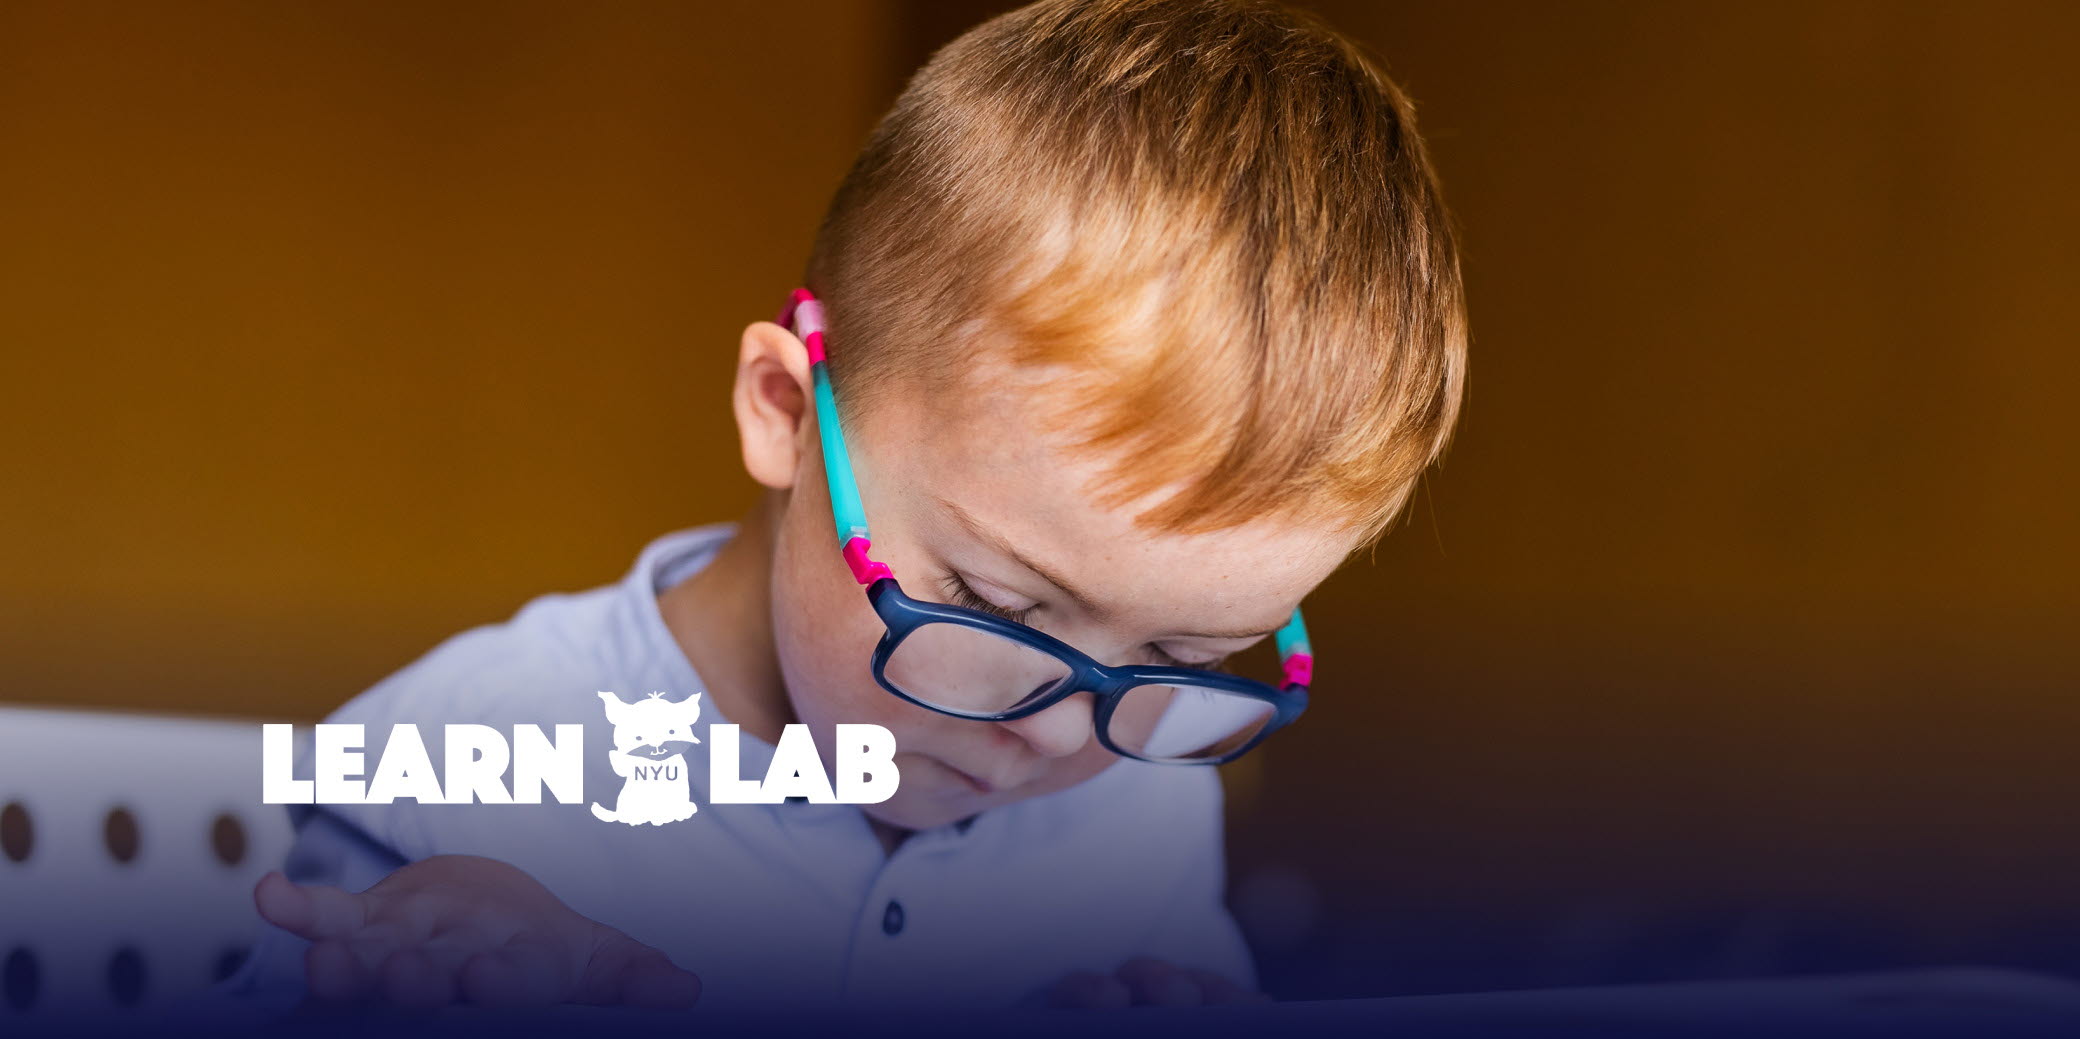
Understanding how children learn language
New York University’s Learn Lab uses eye tracking to study the learning mechanisms underlying language acquisition in children who are typically developing as well as children on the autism spectrum.
Understanding child psychology with eye tracking
In this webinar experienced researchers will share their insights using eye tracking in developmental, clinical, and educational-psychology research in infants and children.

Insights into autism research with eye tracking
In this panel discussion, research experts from Stanford School of Medicine, Uppsala University, and Karolinska Institute shared their experiences with the unique insights eye tracking provides in the field of autism and answered audience questions.
Scientific publications
Did you know that over 12,000 scientific publications feature Tobii eye tracking technology? Discover the latest trends in eye tracking for Developmental psychology research by exploring our scientific publication library.
Related products
Tobii Pro Spectrum
This high-performance research system captures gaze data at speeds up to 1200 Hz. A screen-based eye tracker for extensive research from fixation-based studies to micro-saccades.
Tobii Pro Fusion
Screen-based eye tracker, capturing gaze data at speeds up to 250 Hz. This powerful research system supports from fixation to saccade-based research outside of the lab.
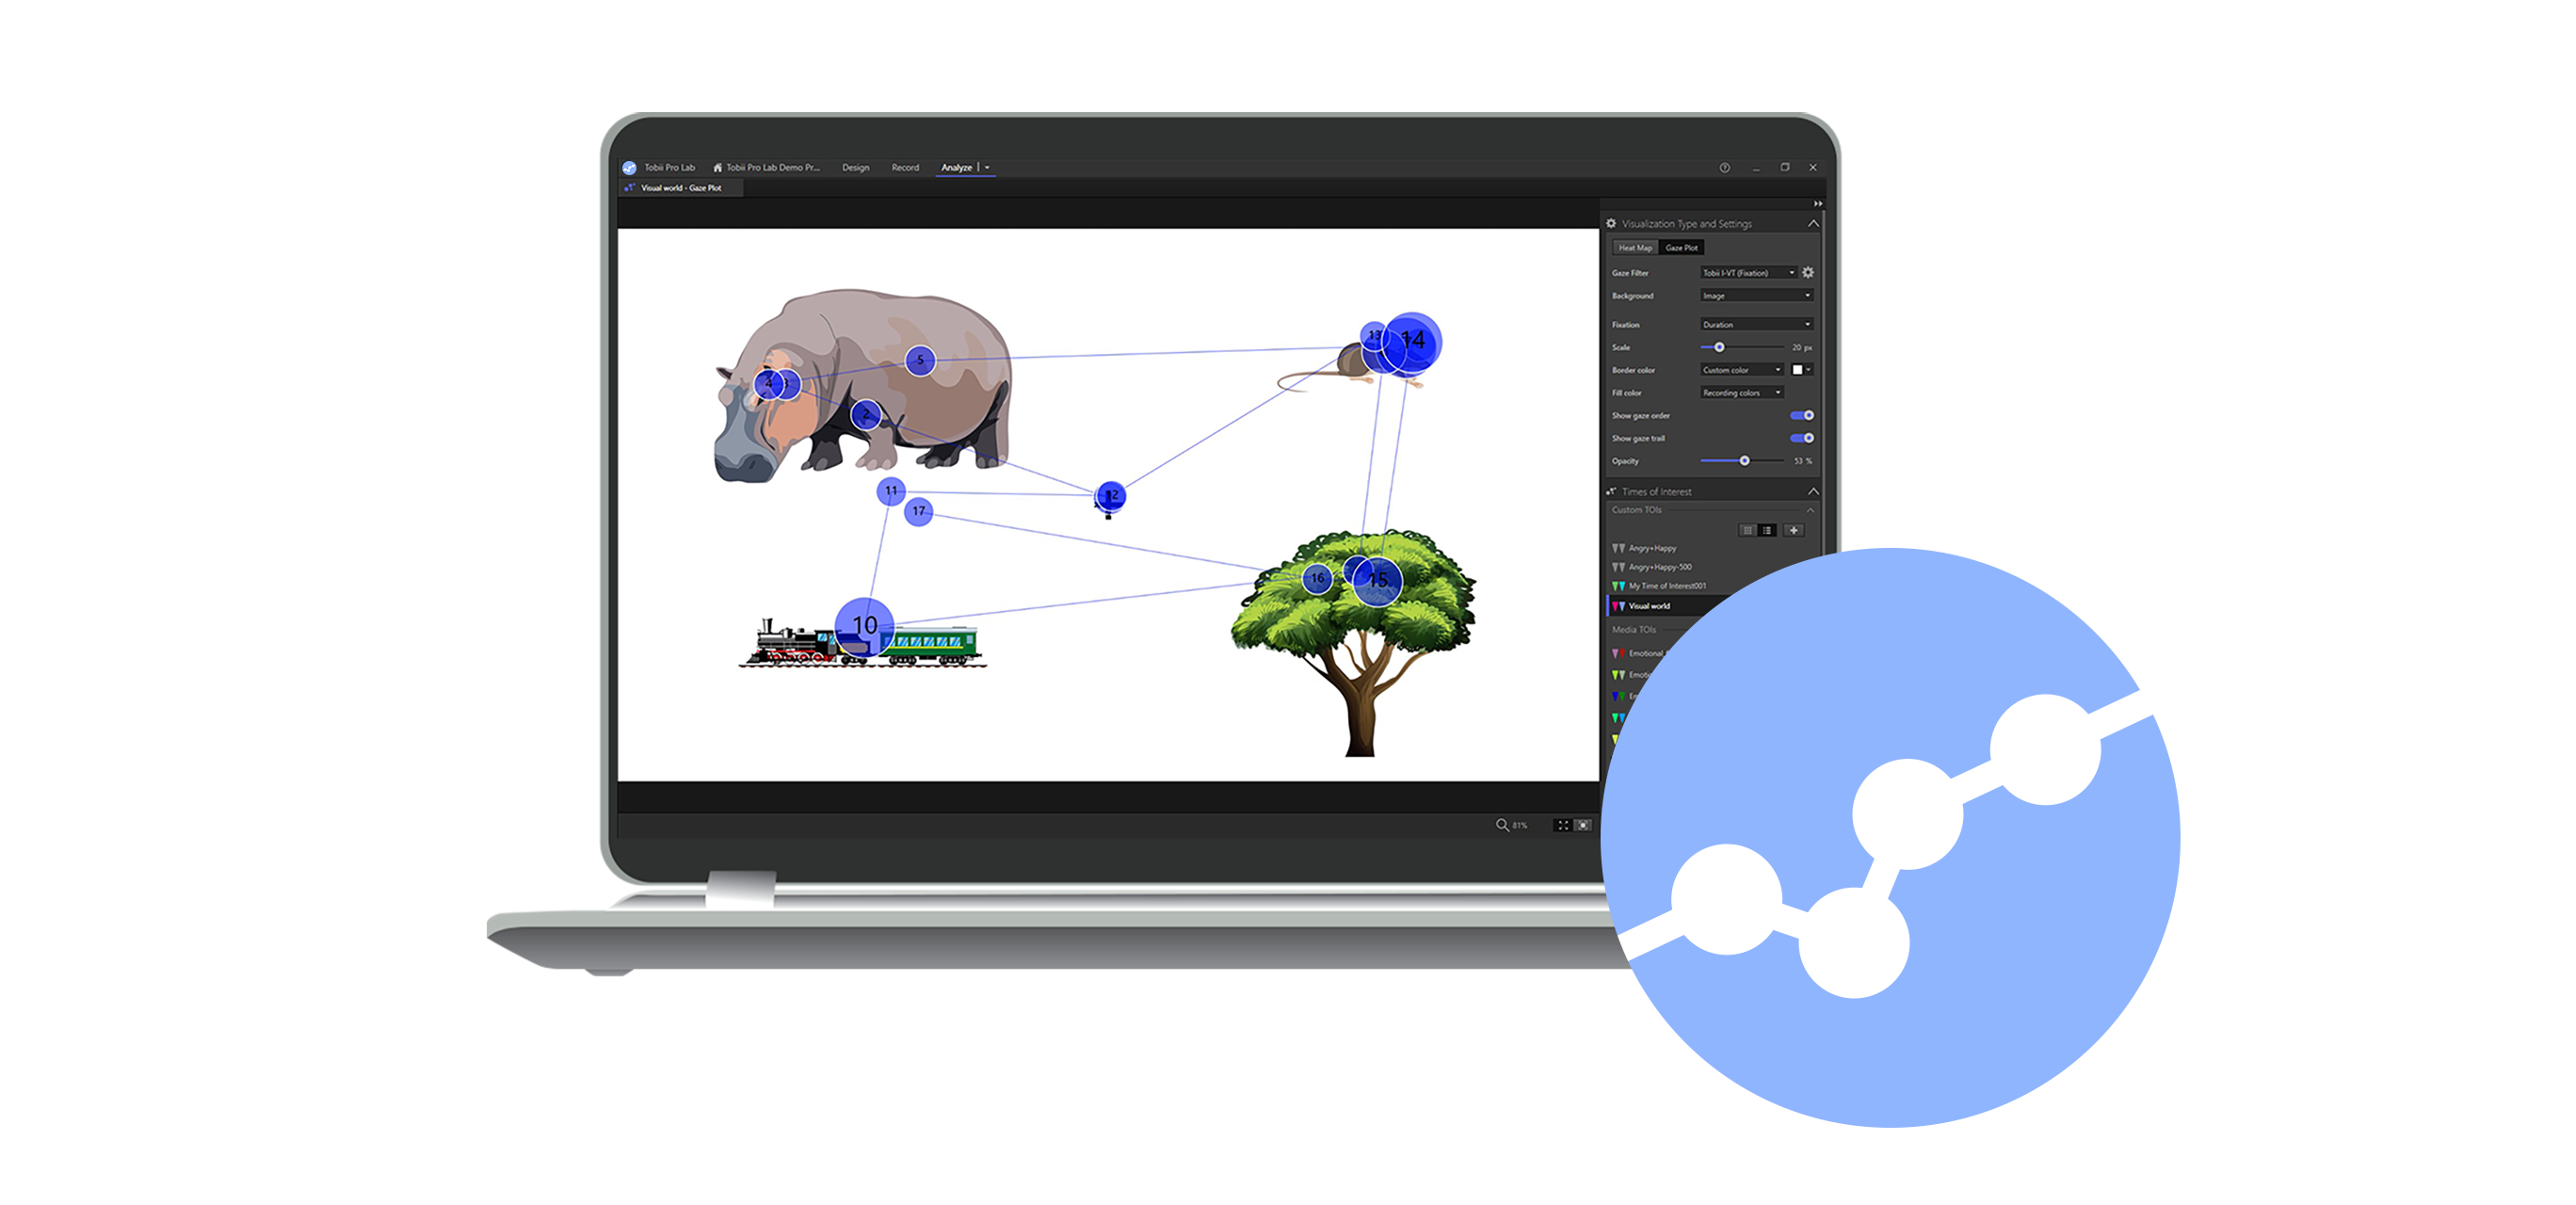
Tobii Pro Lab
Tobii Pro Lab, our eye tracking software supporting screen-based and wearable eye trackers. Guides the researcher through the entire research workflow.
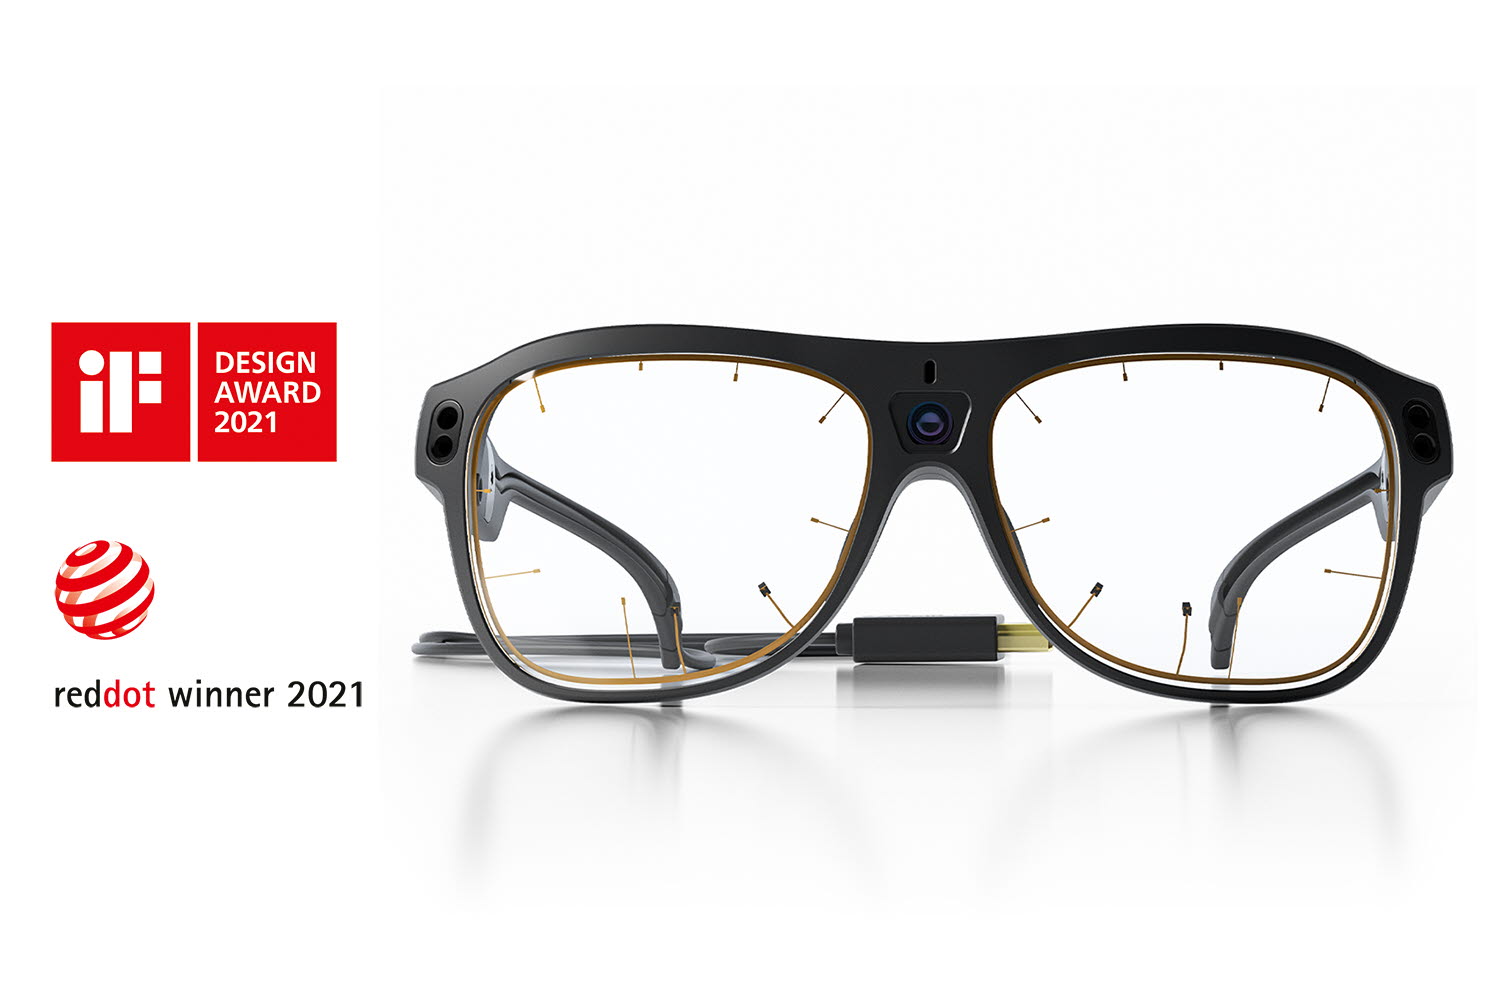
Tobii Pro Glasses 3
Designed for the real world, our third-generation wearable eye tracker allows you to conduct behavioral research in a wide range of settings.
Enabling success
Tobii offers tailored support to address research needs throughout your journey with Tobii’s eye tracking.

Tobii Funding support services
Tobii Funding support services help you improve your grant proposals for research that includes eye tracking in its methodology
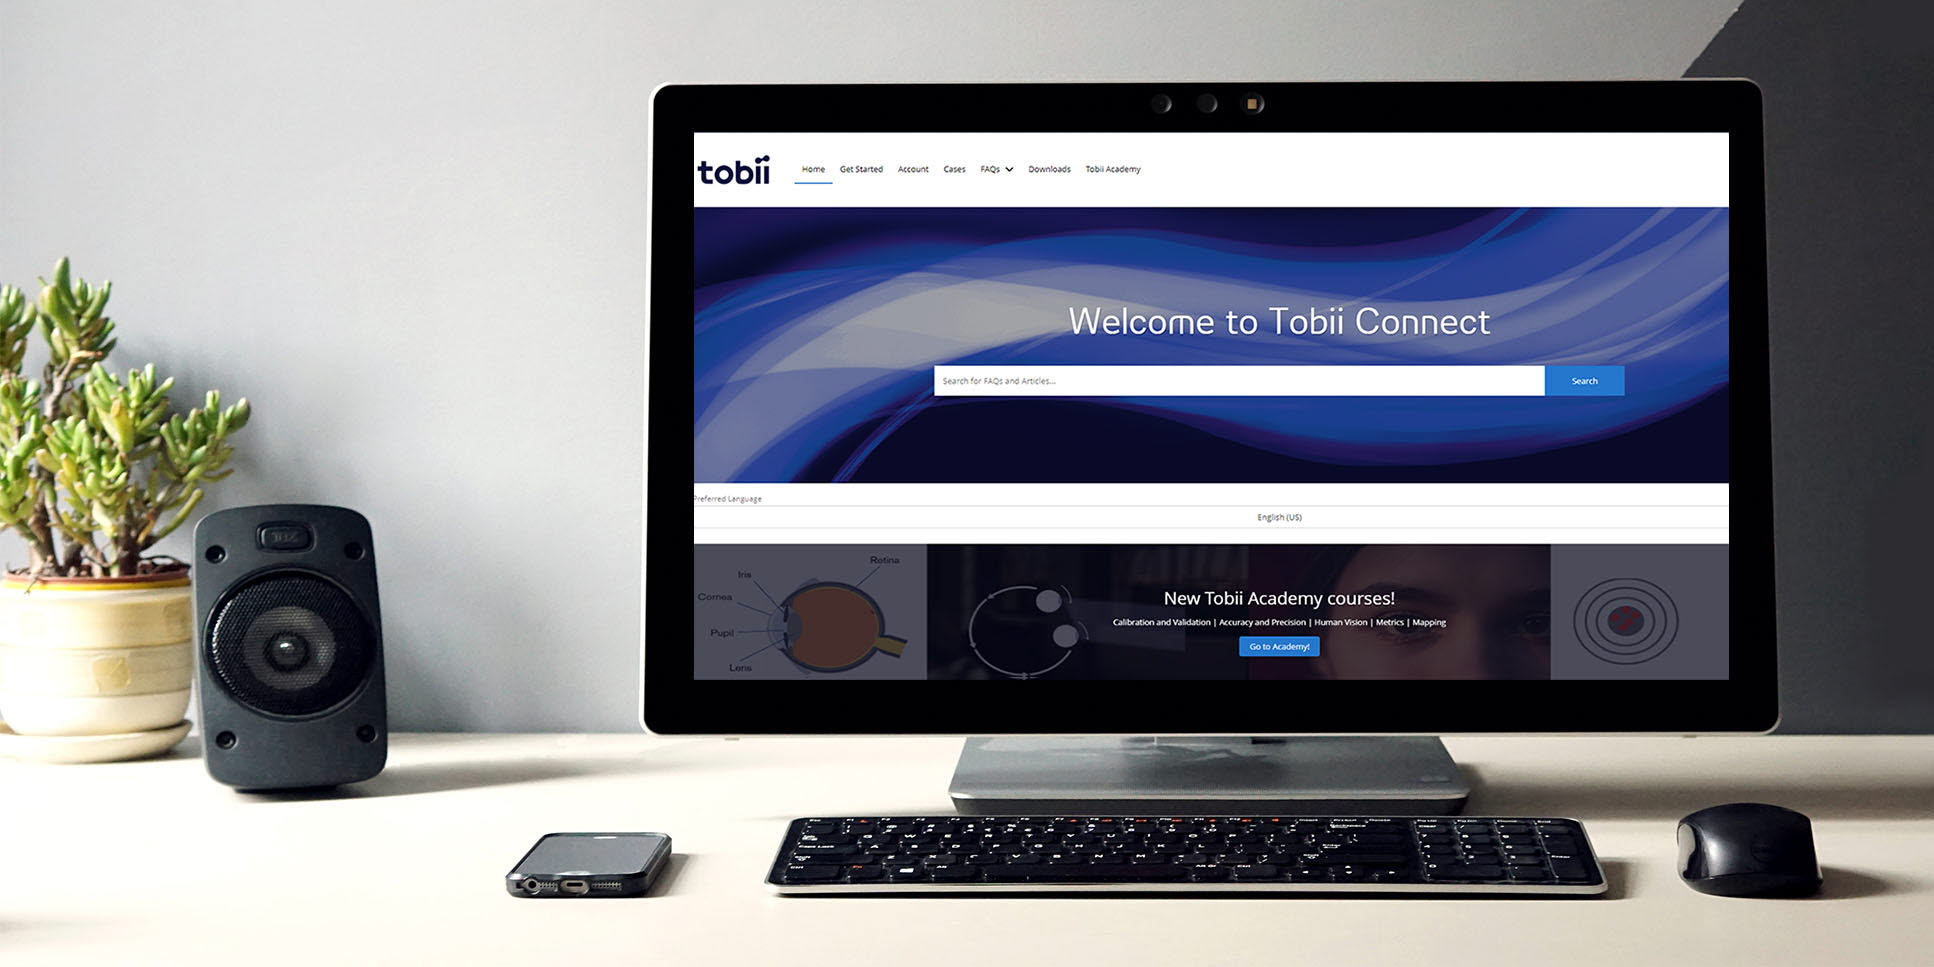
Tobii Connect
Tobii Connect delivers product documentation, how-to guides, and answers to FAQs as well as access to software updates. Our customer care services help with any technical issues concerning Tobii products.
Tobii Academy
Tobii Academy our online learning platform, helping you ensure study success at every step of the way from study design to interpreting your eye tracking data.